Eighth Example – Project Planning for Construction of 3-bedroom House
If the Project Manager has a costed project schedule and wants to know options for minimising the project duration, what advice should the Project Planner provide? Read on to see how all key information can be provided through the #TimeCostCurves program.
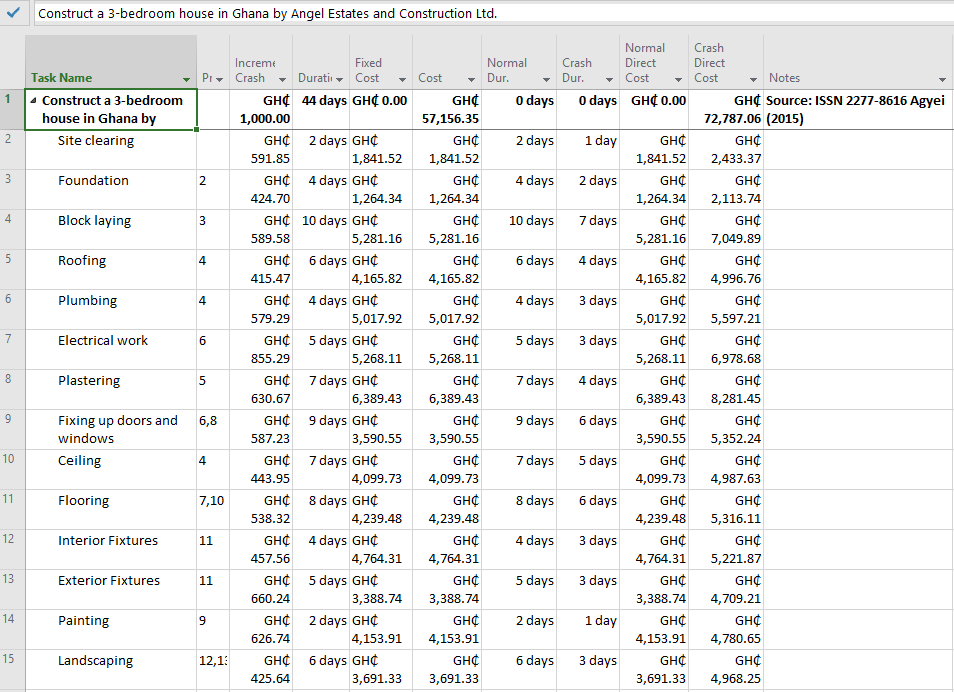
Figure 1: Costed project schedule setup for producing the TimeCostCurve. Overheads are assumed to be GH₵ 1,000 per day.

Figure 2: Normal conditions schedule. (Note that “$” symbol should be read as “GH₵” in this example for Ghanian currency)
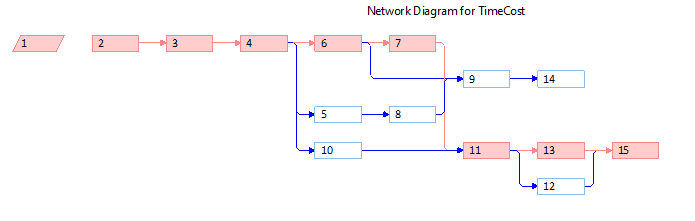
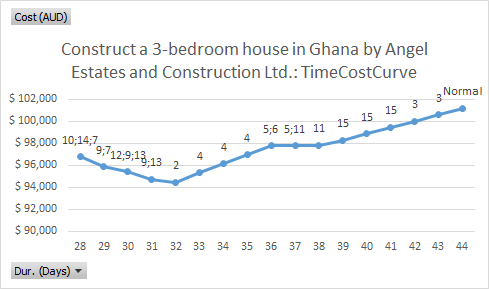
Figure 3: Automated activity selection TimeCostCurve with task ID data points. By inspection, the order of activities being crashed can be rearranged manually as below to make a smooth TimeCostCurve, which would be the practical order of activity crashing.
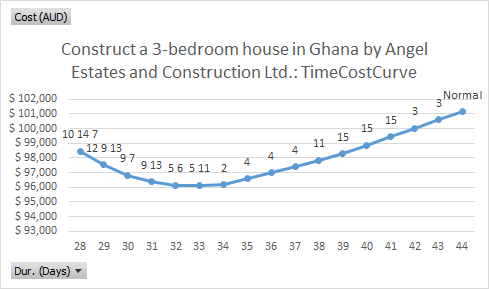
Figure 4: Smoothed TimeCostCurve with Task ID data points.
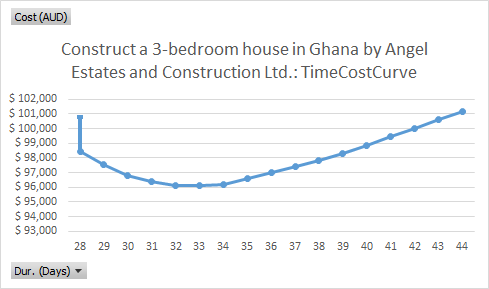
Figure 5: TimeCostCurve with fully crashed data point (added manually)
Advise based on TimeCostCurve program:
| Schedule: | Duration (days): | Cost (GH₵): | Remarks: |
|---|---|---|---|
| Normal schedule | 44 days | GH₵ 101,156.35 | |
| Least-cost schedule | 32 days | GH₵ 96,130.11 | |
| Least-time schedule | 28 days | GH₵ 98,451.09 | |
| Fully-crashed schedule | 28 days | GH₵ 100,787.06 | The added cost compared to the least-time schedule is of no benefit since the critical path cannot be further shortened. |
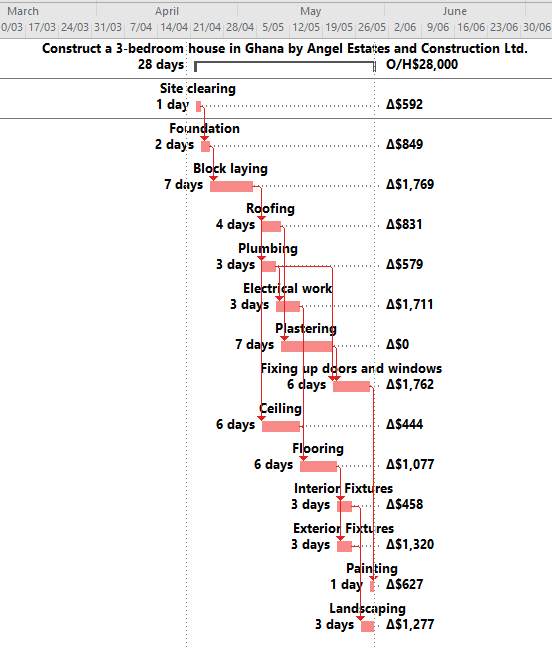
Figure 6: Least-time schedule