Seventeenth Example – Engineering Project Example
If the Project Manager has a costed project schedule and wants to know options for minimising the project duration, what advice should the Project Planner provide? Read on to see how all key information can be provided through the #TimeCostCurves program.
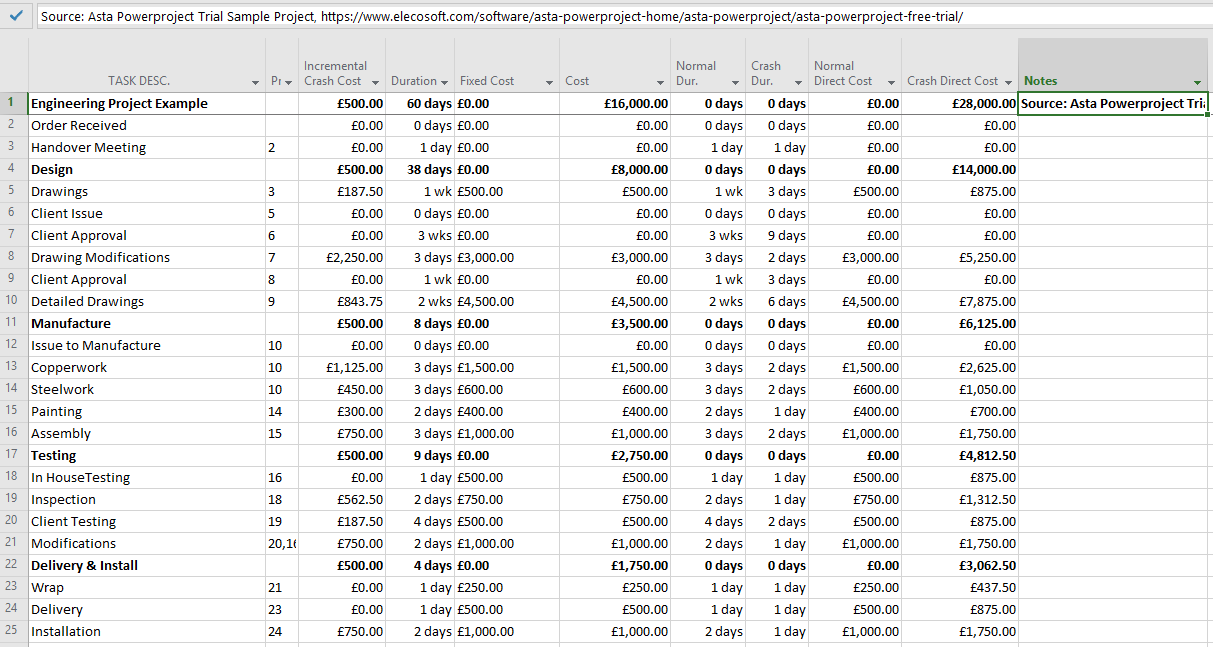
Figure 1: Costed project schedule setup for producing the TimeCostCurve.
Setup assumptions for TimeCostCurve program:
| Assumptions: | Assumed Value: | Remarks: |
|---|---|---|
|
£ 500/day | Equivalent to about 2 full-time senior engineers |
|
£ 16,000 | Direct (normal) costs |
|
Crash duration = 4/7*Normal duration (rounded to nearest day) Crash cost = 7/4*Normal cost |
8 normal hours + 6 overtime hours = 14 total hours. Therefore ratio is 8/14 or 4/7 |
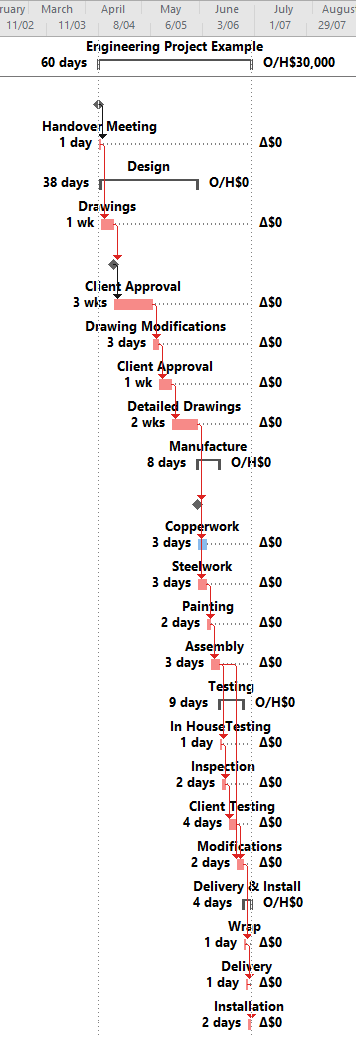
Figure 2: Normal conditions schedule.
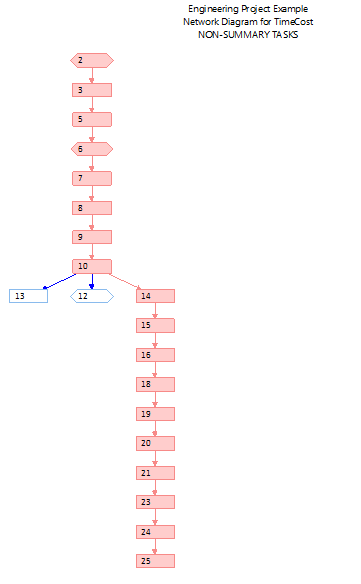
Figure 3
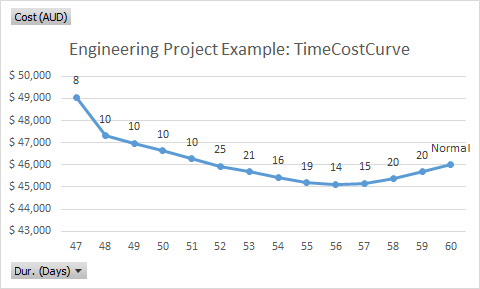
Figure 4: TimeCostCurve with crashed Activity ID’s at data points. NB: Cost (AUD) should read Cost (£)
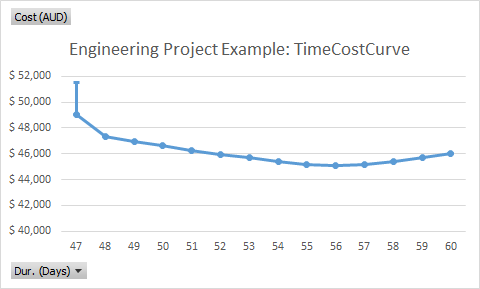
Figure 5: TimeCostCurve with fully-crashed schedule data point. NB: Cost (AUD) should read Cost (£)
Advice based on TimeCostCurve program:
| Schedule: | Duration (days): | Cost (£): | Remarks: |
|---|---|---|---|
| Normal schedule | 60 days | 46,000 | |
| Least-cost schedule | 56 days | 45,125 | |
| Least-time schedule | 47 days | 49,063 | |
| Fully-crashed schedule | 47 days | 51,500 |
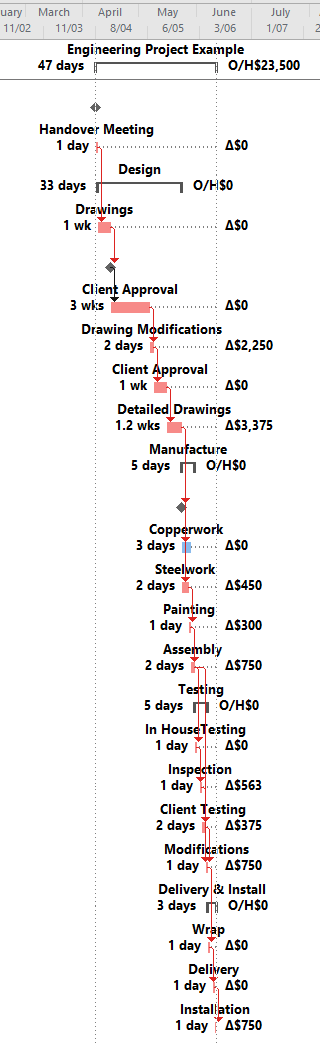
Figure 6: Least-time schedule
NB. If we change our assumption so that activities can only be crashed by working 2 hours of overtime (after a normal 8 hours), rather than 6 hours of overtime, then the resulting TimeCostCurve would appear as below:
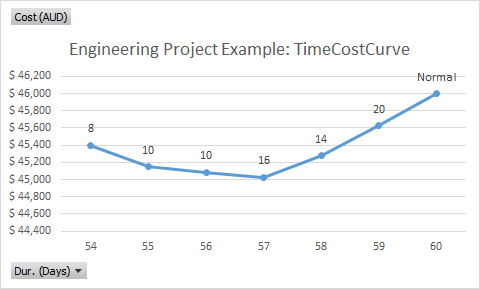
Figure 7: TimeCostCurve with crashed Activity ID’s at data points. NB: Cost (AUD) should read Cost (£)