Seventh Example – Sample Network
If the Project Manager wants to know options for the costed project schedule, what should the Project Planner provide? Read on to see how all key information can be provided through the #TimeCostCurves program.
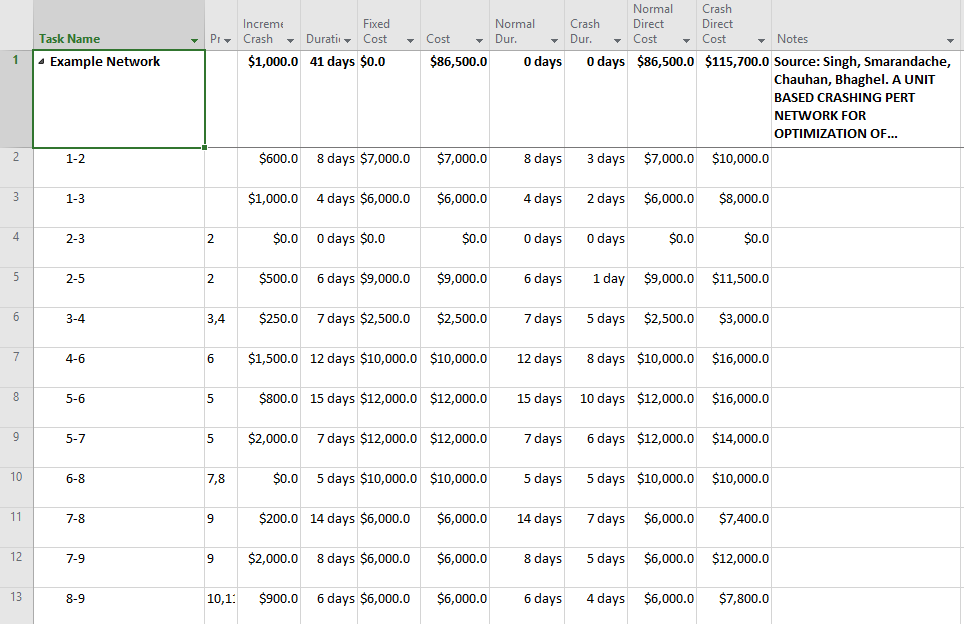
Figure 1: Setup the schedule for producing the TimeCostCurve.
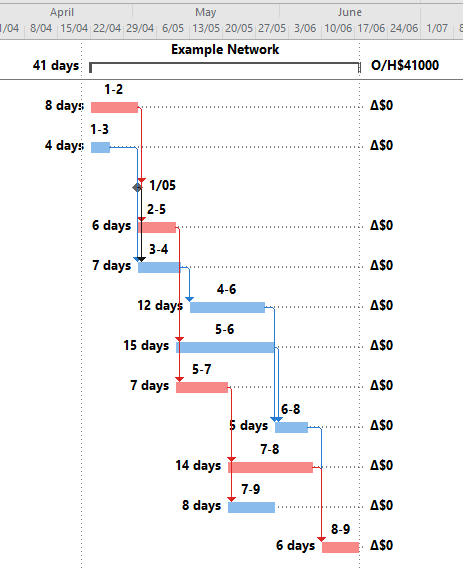
Figure 2: Normal conditions schedule.
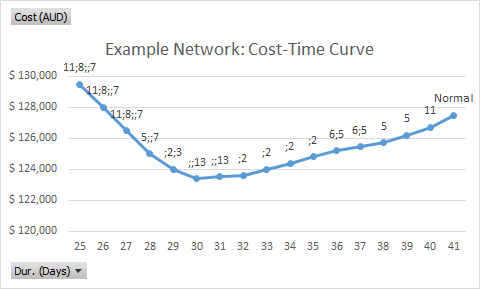
Figure 3: TimeCostCurve with task ID data points
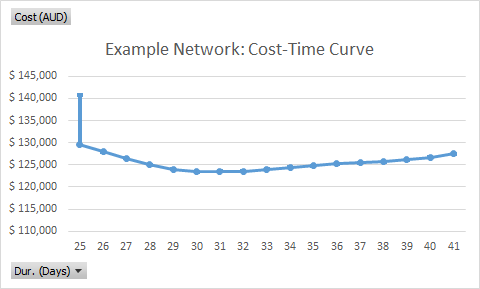
Figure 4: TimeCostCurve with fully crashed data point
| Advise based on TimeCostCurve program | |||
|---|---|---|---|
| Schedule: | Duration (days): | Cost ($): | Remarks: |
| Normal schedule | 41 days | $127,500 | |
| Least-cost schedule | 30 days | $123,400 | |
| Least-time schedule | 25 days | $129,500 | |
| Fully-crashed schedule | 25 days | $140,700 | The added cost compared to the least-time schedule is wasted since the critical path cannot be further shortened. |
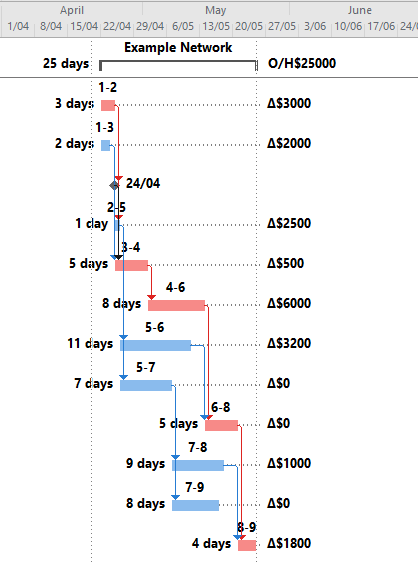
Figure 5: Least-time schedule