Third Example
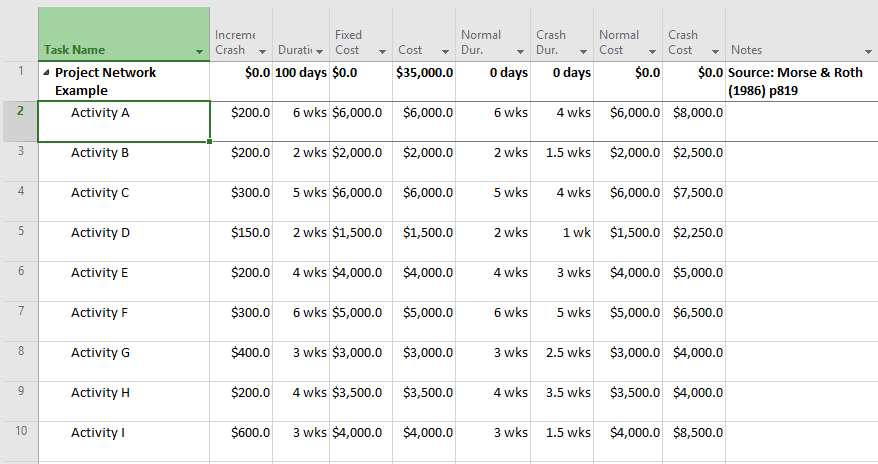
Figure 1: Setup the schedule for producing the cost-time curve
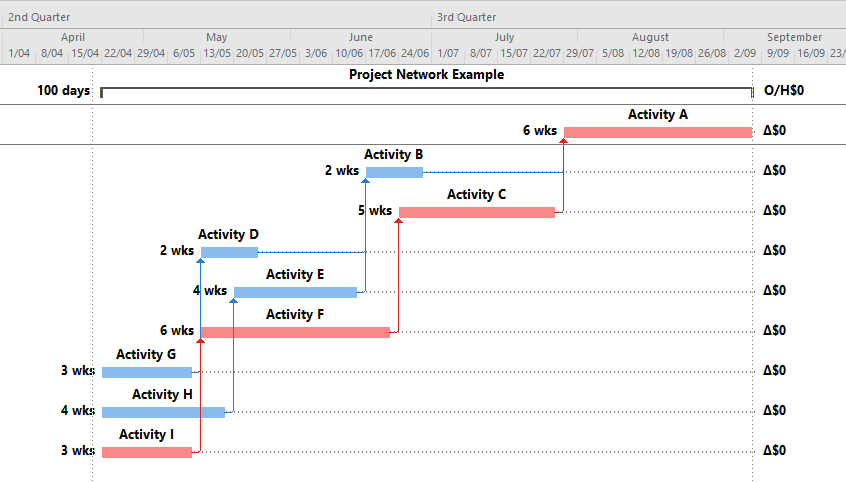
Figure 2: Normal schedule: the project manager may assess the project plan as being too long, so takes steps as below. Indirect costs (overheads) are ignored in this example (set to $0). Total direct costs are $35,000 for this normal schedule.

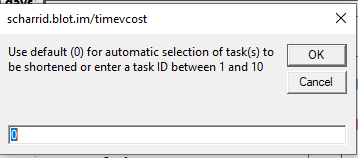
Figure 3: Click the code button, and select default (0) to run the program. Repeat 10 times to proceed to the below stage
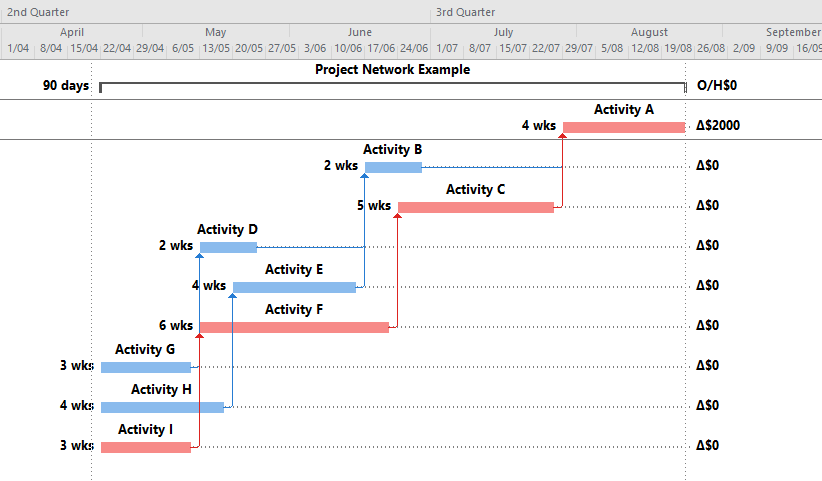
Figure 4: Activity A would be the least-cost activity to compress, by 10 days (from 6 weeks to 4 weeks) as per the setup data, costing the project an additional $2000 in direct costs to Activity A.
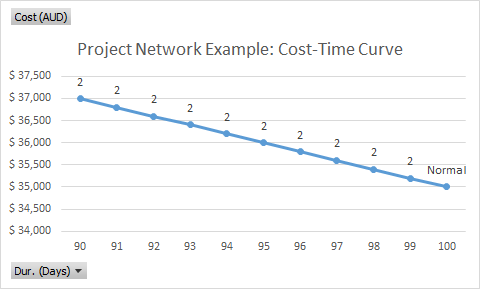
Figure 5: Cost Time Curve for the project shortened by 2 weeks (10 days), costing an additional $2,000 (ie 90 days, $37,000)
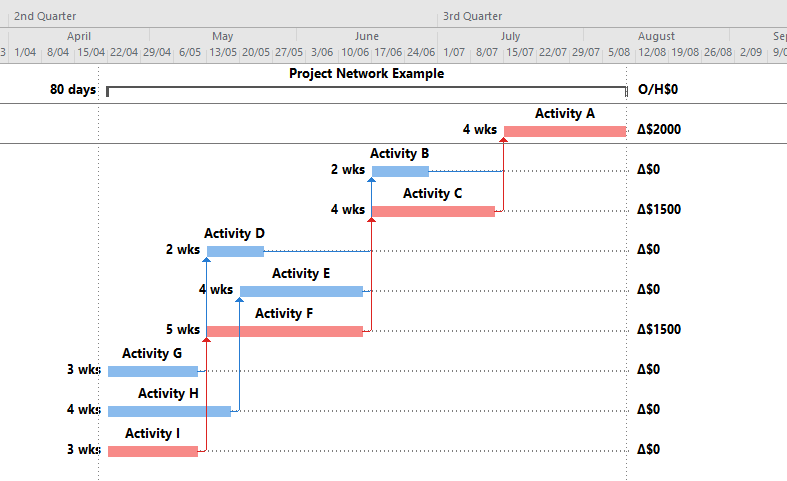
Figure 6: Activities C and F are then compressed by 1 week each, shortening the project to 80 days, but now the additional direct costs add to $5,000, bringing total direct costs to $40,000.
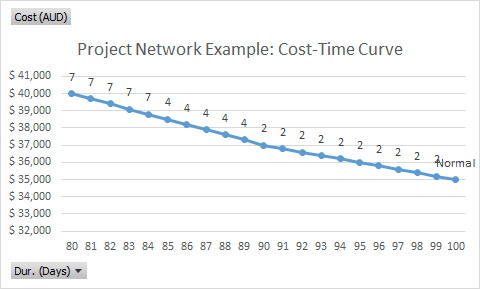
Figure 7:Cost Time Curve for the project shortened by a further 2 weeks, now costing an additional $5,000 (ie 80 days, $40,000)
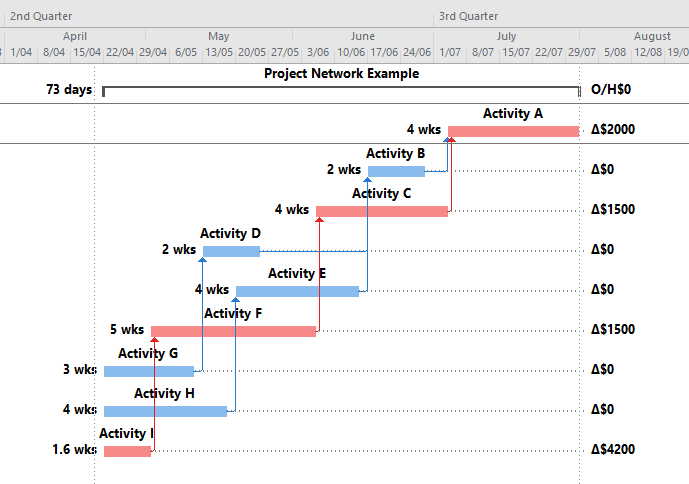
Figure 8: Least-Time Schedule (73 days, costing $44,200)
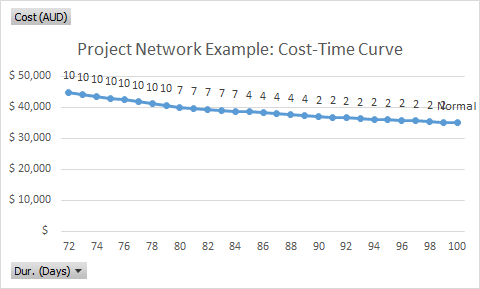
Figure 9: Cost-Time Curve for the least-time schedule (NB as noted above, indirect costs are ignored, so the least-cost schedule cannot be calculated)