Activity-on-Arrow (AOA) Diagrams based on MS Project data
- Only now can AOA Diagrams be easily produced from an MS Project file, through an extension to MS Project.
by Stephen Richards 16 October 2020
Contact: https://linkedin.com/in/timecostcurves
Activity-on-Arrow Diagrams have the great benefit of providing a visualisation of the logic of a project network that is often clearer than the default Precedence Diagrams typically available in project planning software. The extension App provides the input to the online Mermaid Live Editor, which then produces the diagram. The diagram is editable, which is doubly important since the current version of the MS Project extension does not purport to correctly represent all types of project networks. Also, the layout of the AOA Charts are shown as top-down to better fit on the page, despite the convention of time being represented as flowing from left-to-right. This can be easily edited according to preference.
The AOA Diagrams easily produced in a few clicks have these benefits:
Readable, Presentable and Professional Layout
Editable
Critical Path shown
Improves accuracy when drafting project plans
Improves communication of your project plans
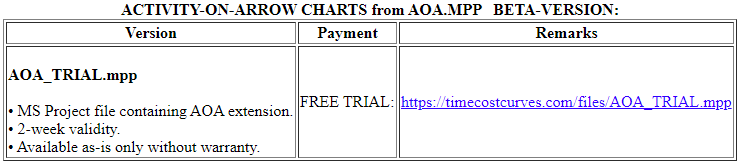
Currently, a trial version is available. Please contact the author if you are interested in using a version with full options.
Here is the method to produce an AOA Diagram from MS Project. An internet connection is required.
Download the MS Project file named AOA_TRIAL.mpp from https://timecostcurves.com/files and open the file:
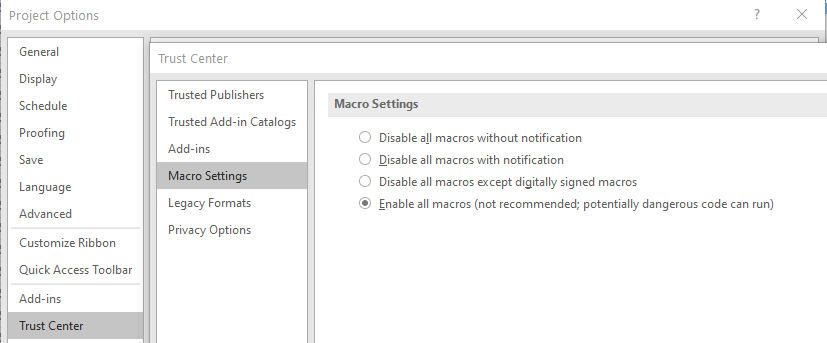
Enable Macros, if required. File > Options > Trust Center > Macro Settings:
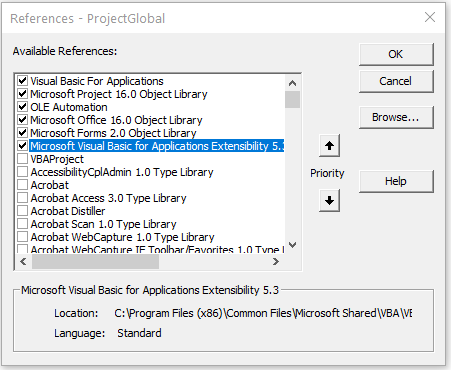
Requires reference to Microsoft Visual Basic for Applications Extensibility 5.3. Open VBA Editor (ALT+F11) > Tools > References:
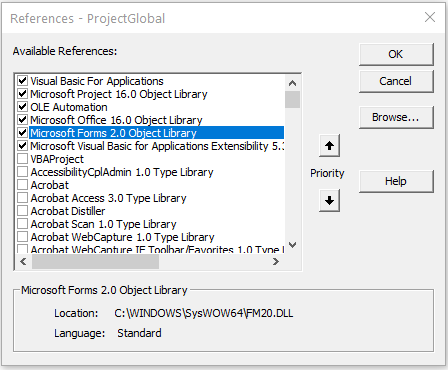
Requires reference to Microsoft Forms 2.0 (for VBA to access your clipboard).
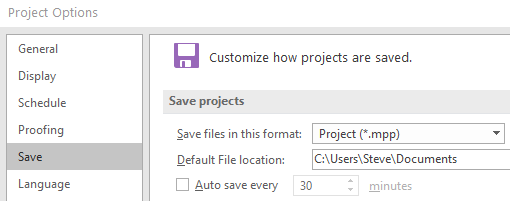
Turn off MS Project Autosave (since the trial version of the App may not work after being resaved). File > Options > Save > uncheck Auto save every…
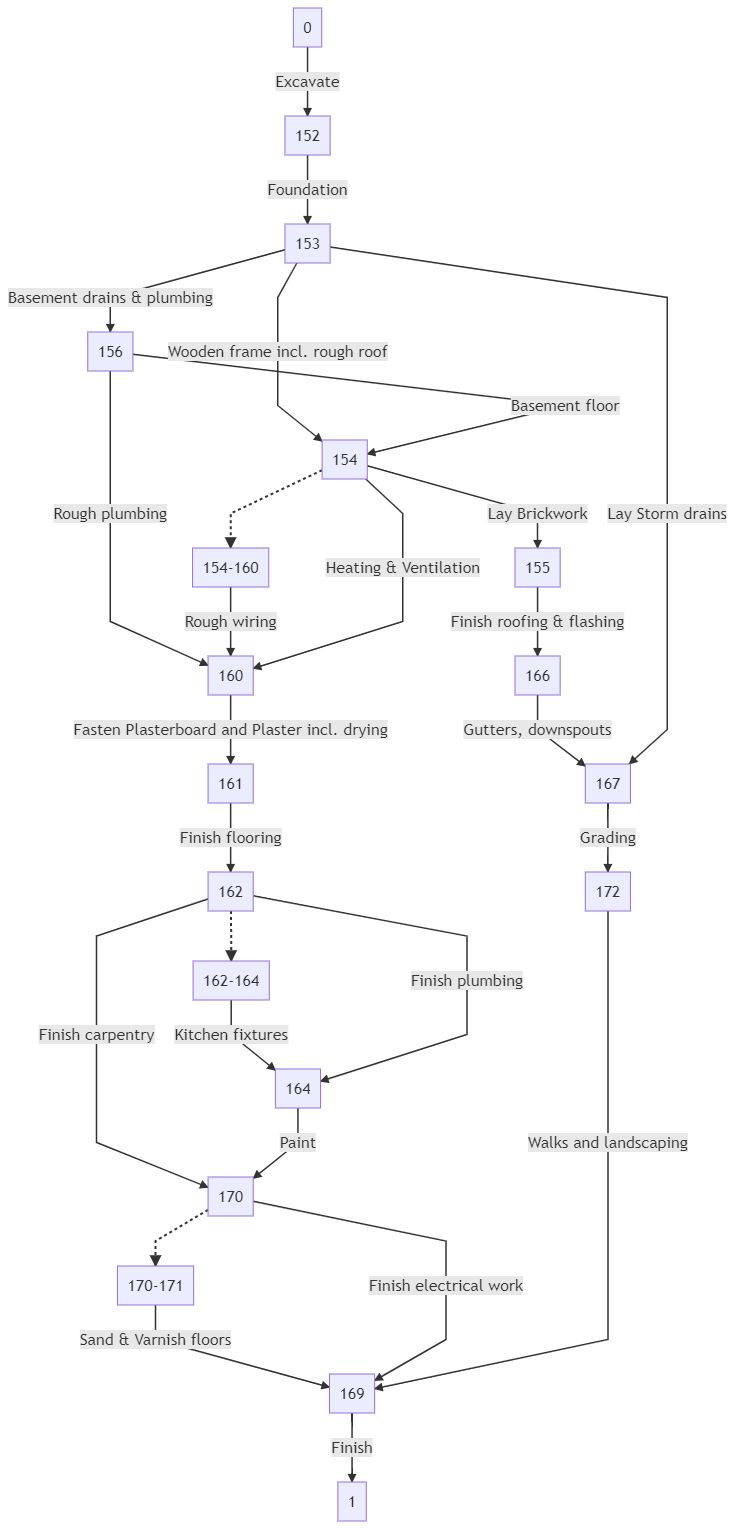
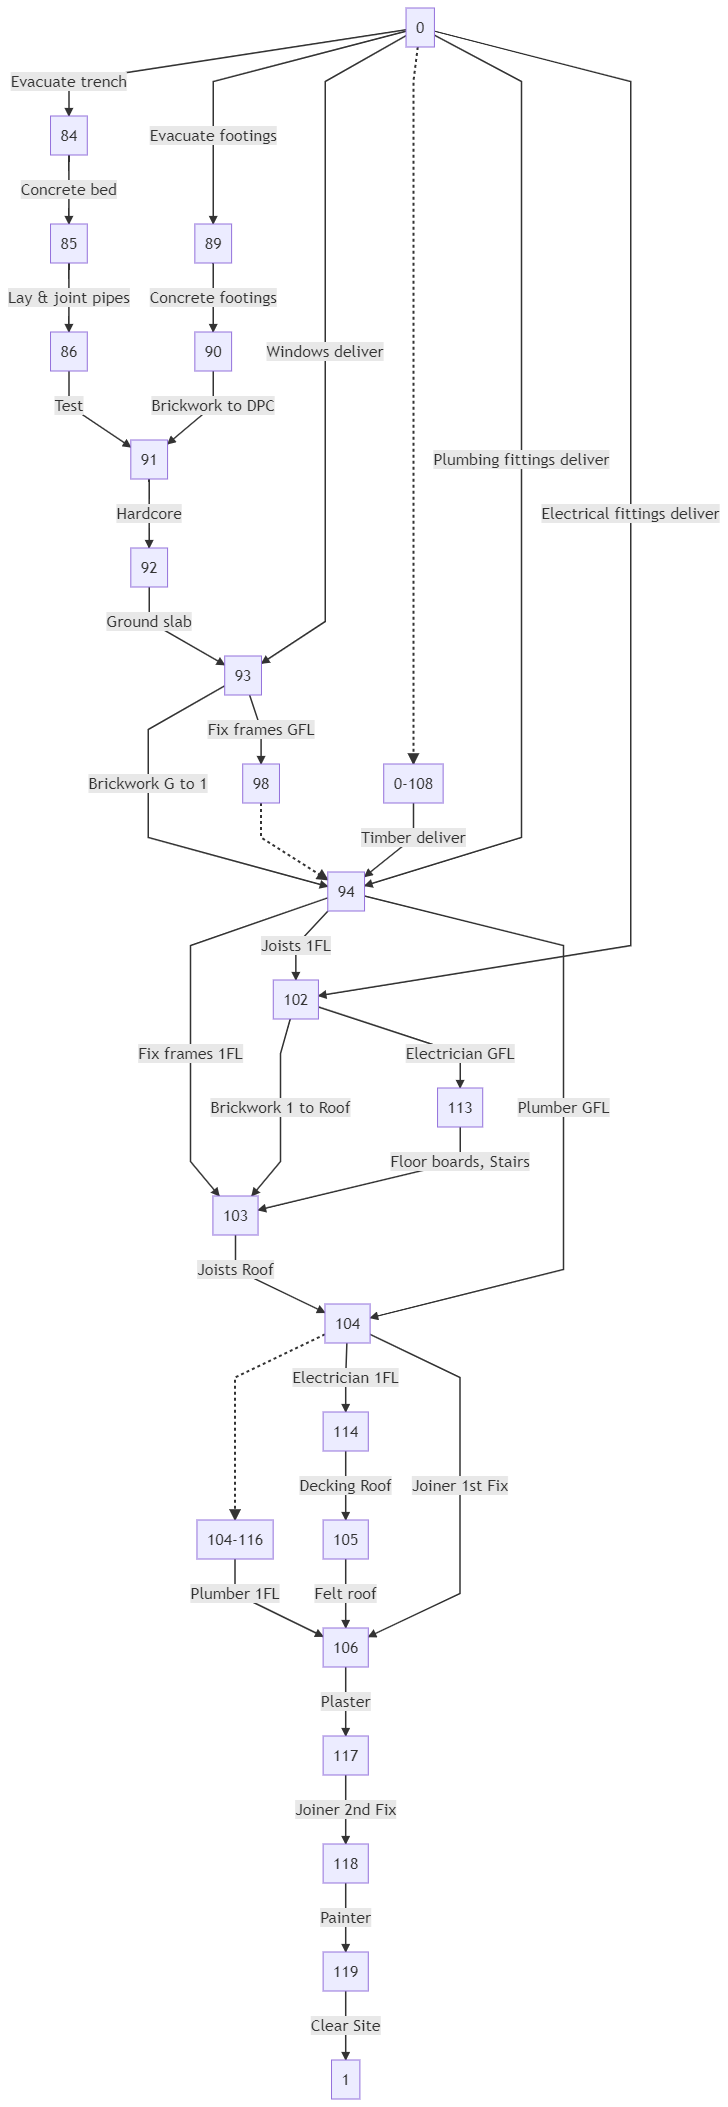
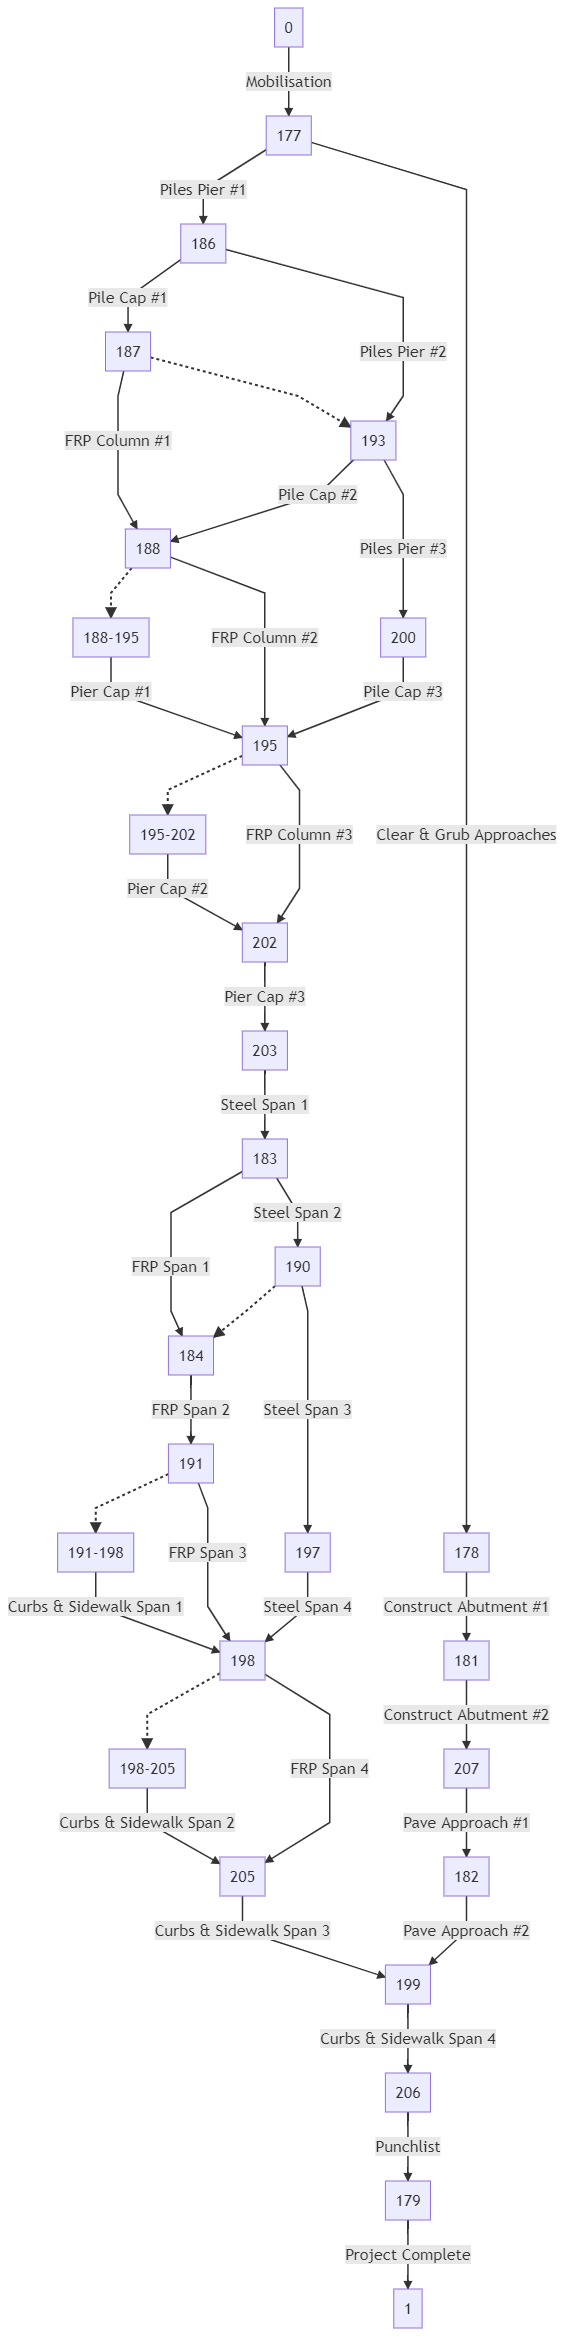
Draft your project network, which requires predecessors. Also, the task descriptions cannot contain brackets and blank rows are not allowed. The file contains an example with 20 non-summary tasks. Screenshots of further examples are included below these instructions.
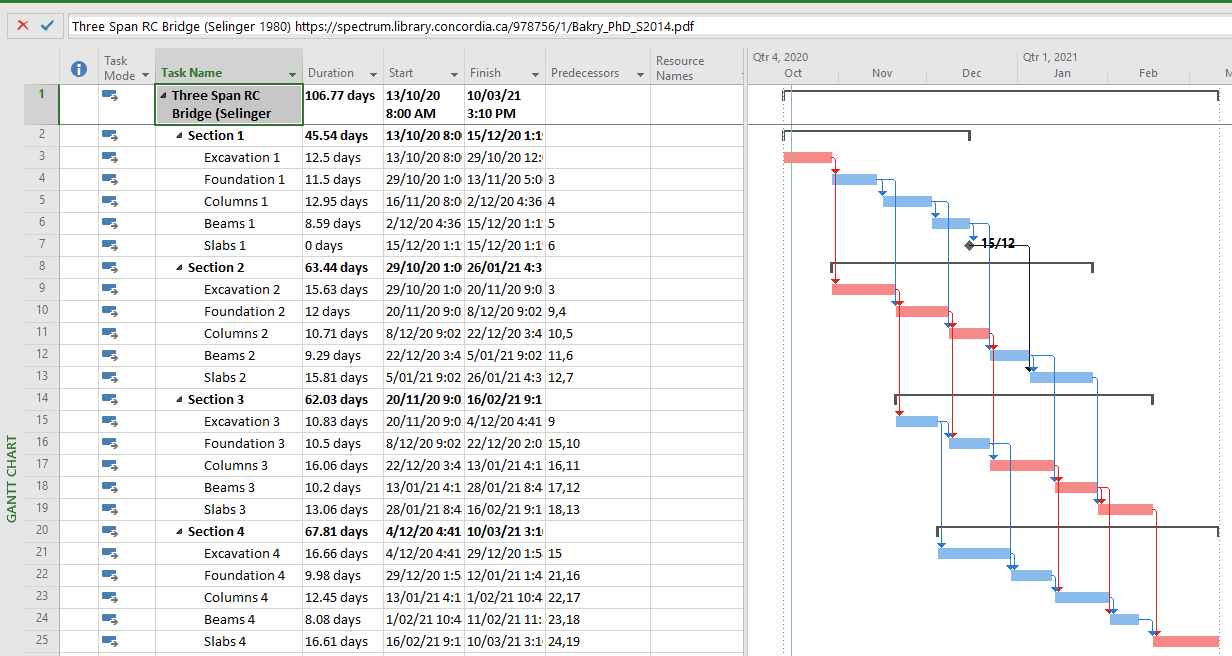
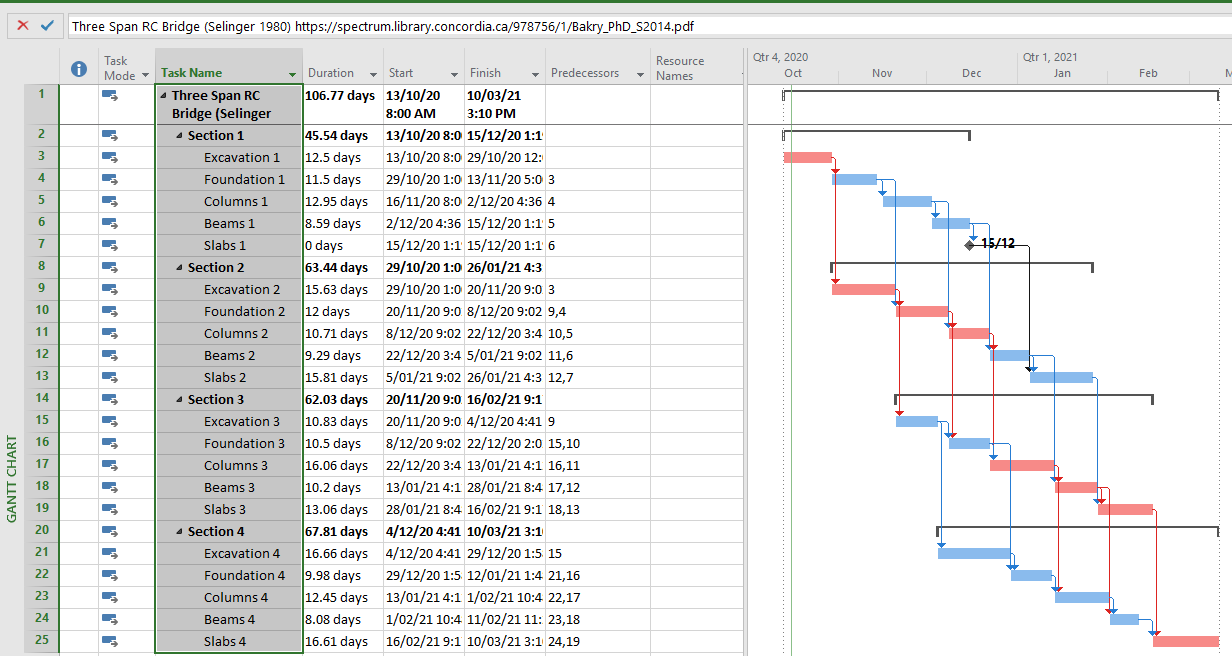
Select the tasks to be included, since the AOA Diagram is only drawn for the tasks that are selected, and summary tasks are ignored (but they can be selected).
Click the AOA Macro, and allow a few moments for the code to run, which includes:
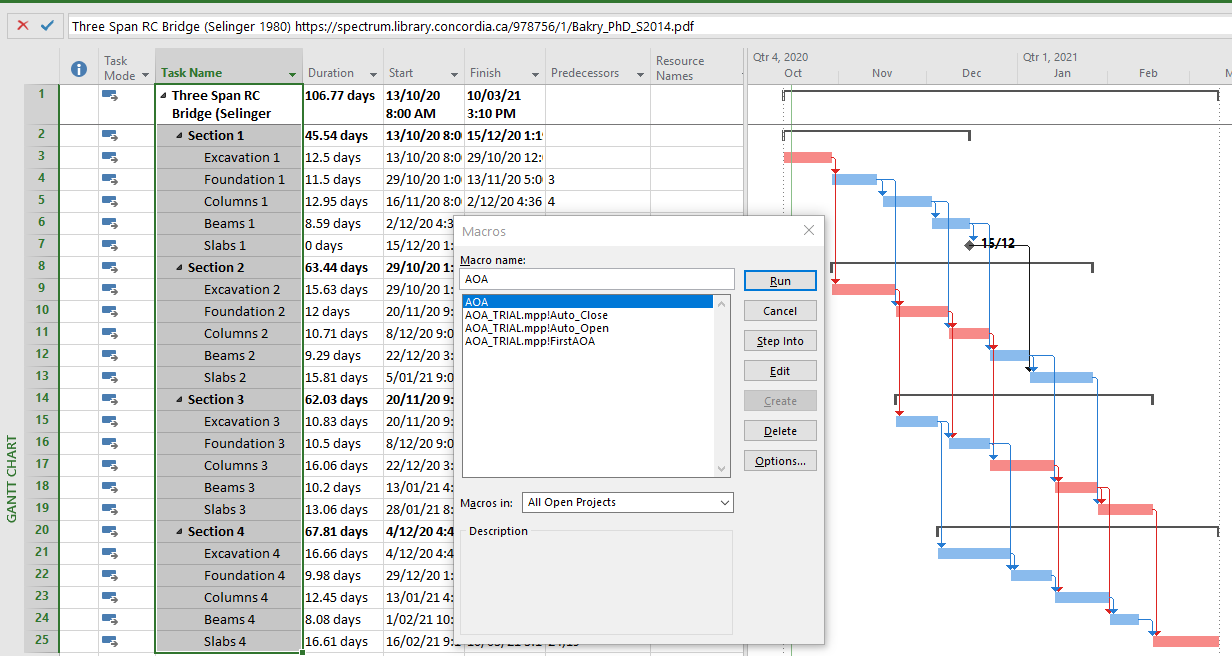
Making use of 3 of MS Project’s custom fields, being Number1, Text 29 and Text 30, so do not store any of your data in these three fields.
A warning message is shown if >100 tasks are selected, since an upperlimit to the AOA Chart is untested and results may be unexpected. Press Yes to continue.
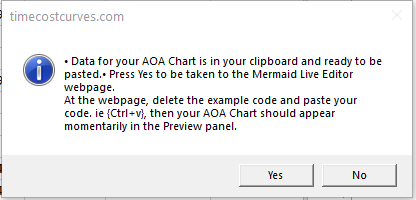
A further message is shown when the data is ready in your clipboard. Press Yes to continue, then the Mermaid Live Editor webpage is opened.
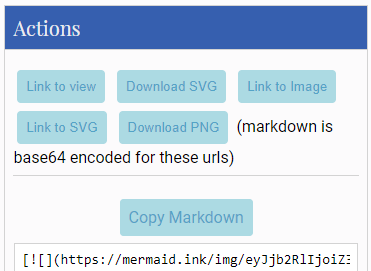
Within the Mermaid Live Editor webpage:
navigate to the code panel on the left
select all the placeholder data
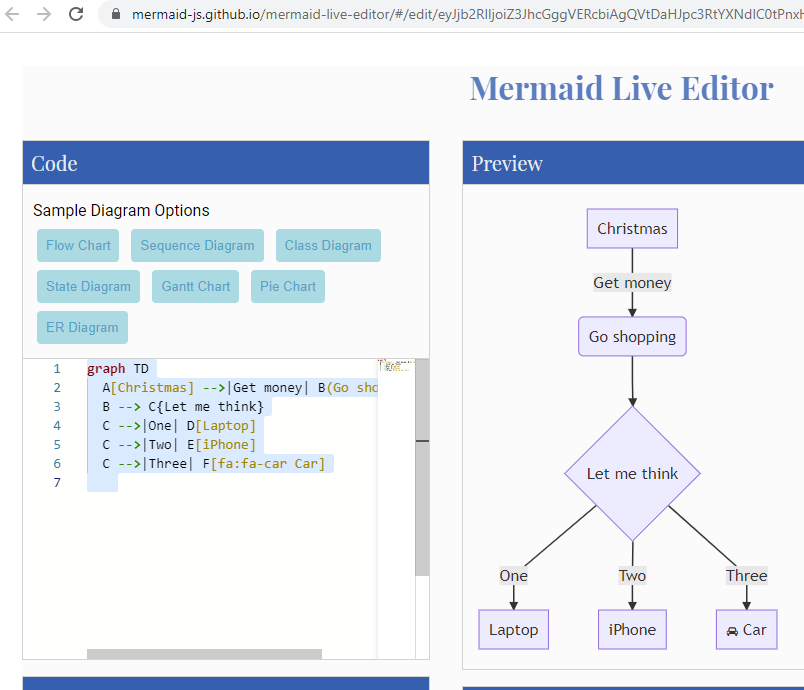
paste your project network data ie {CTRL+v}
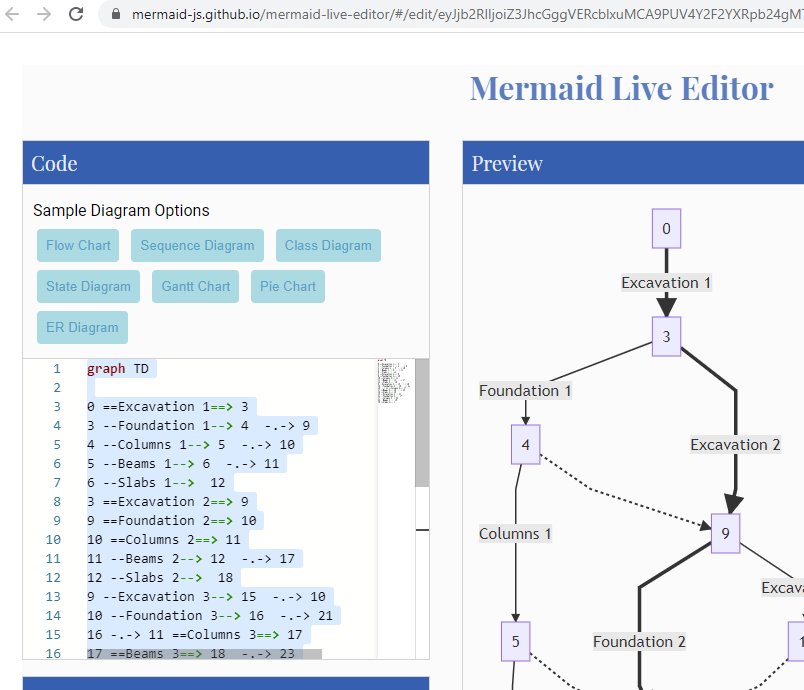
preview the AOA Diagram
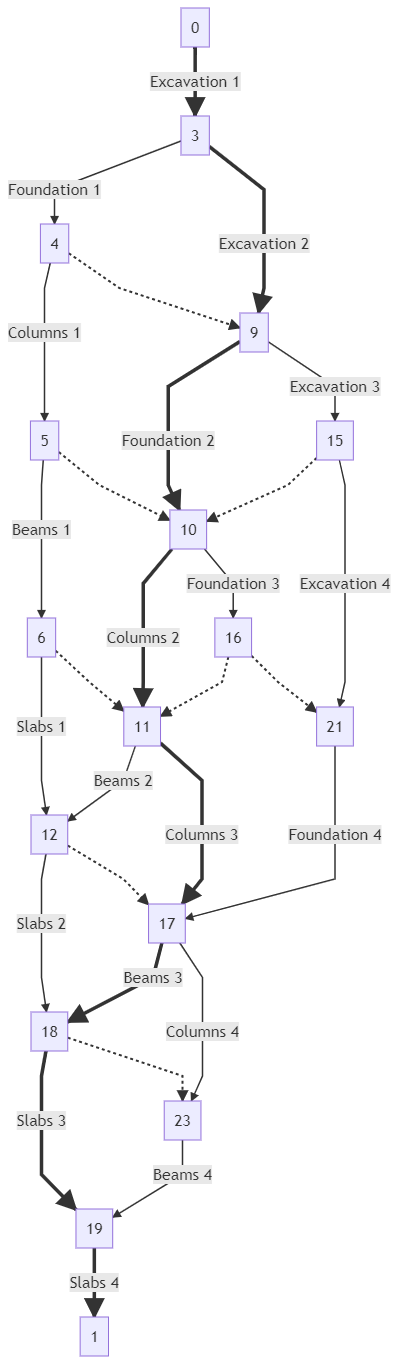
edit the AOA Diagram if required
select format to download from the Action panel if required.