Introducing Cost-Time Curves to MS Project
The .mpp file available for sale elsewhere on this site allows the project scheduler to optimise the schedule with respect to cost, in turn allowing for an explicit decision on whether shortest-time or least-cost should be the prevailing objective of the ‘shorter-than-normal’ project plan.
| START WITH NORMAL SCHEDULE: |
|---|
 |
| FOLLOW PROCEDURE THROUGH TO FULLY-COMPRESSED SCHEDULE: |
 |
| RESULTING COST-TIME CURVE: |
 |
The .mpp file is usable (as-is) for versions of MS Project 2010 and above. It relies on values being input into the following custom fields:
Crash Cost (Cost1)
Normal Cost (Cost3)
Crash Dur. (Duration1)
Normal Dur. (Duration3)
Then the following custom fields need to be reserved for calculations:
Incremental Crash Cost (Cost4)
Reverse (Number4)
SwapDur (Number5)
Cost of Crashing (Text30)
Also, the .mpp file contains a filter called “Critical for TimeCost” which is required.
The .mpp file also relies on MS Excel to plot the Cost-Time Curve, with the file being programmatically saved to the C:\Temp\ directory. Please note that MS Excel should be closed when you begin to run the code.
Herewith is a how-to description:
SETUP:
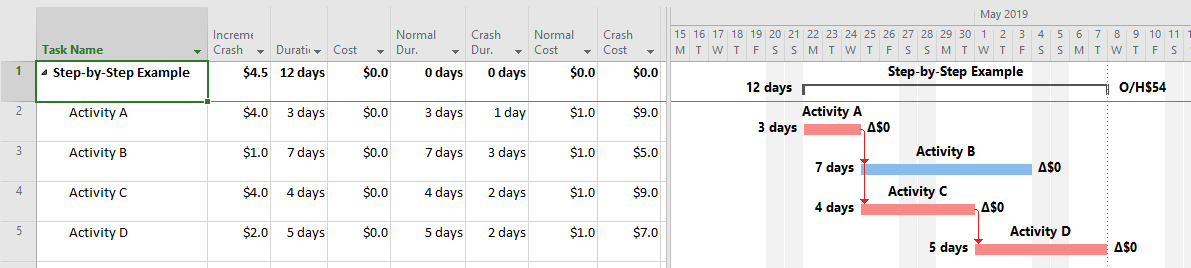
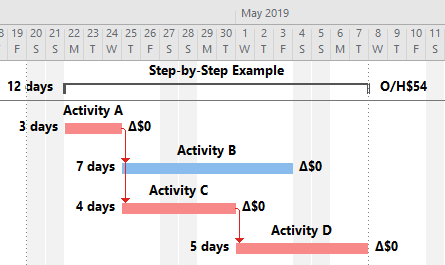
Figure 1: Input as required
STEP 1:

Figure 2: Click the code button in the ribbon. Each click (together with dialog box selection as per Fig. 3 below) results in a successively shorter schedule until the project cannot be shortened any further. The schedule and a related MS Excel chart are re-calculated at each step. Prior to saving the .mpp file, undo within MS Project is available.
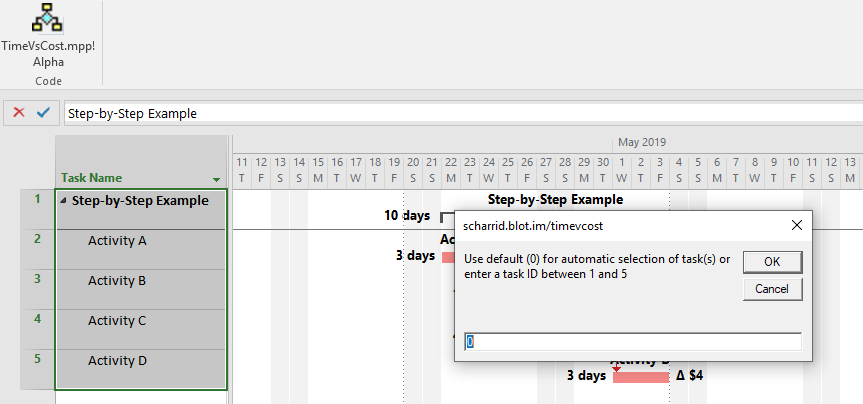
Figure 3: follow dialog box instructions, in this case choose 0 (press OK)
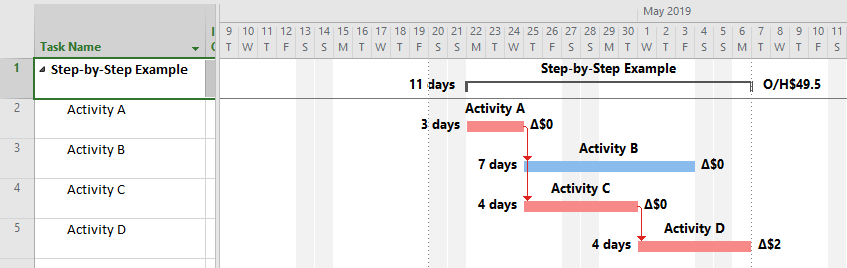
Figure 4: Schedule shortened from 12 days to 11 days, due to Task ID 5 (Activity D)
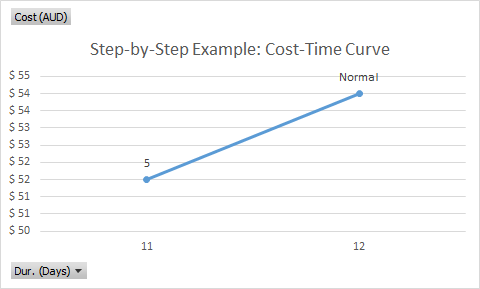
Figure 5: MS Excel chart showing change in cost for 1 day shorter schedule (from 12 to 11 days)
STEP 2: (REMAINING STEPS JUST A REPEAT OF STEP 1 FOR THIS SIMPLE EXAMPLE)
|
|
 →
→ 
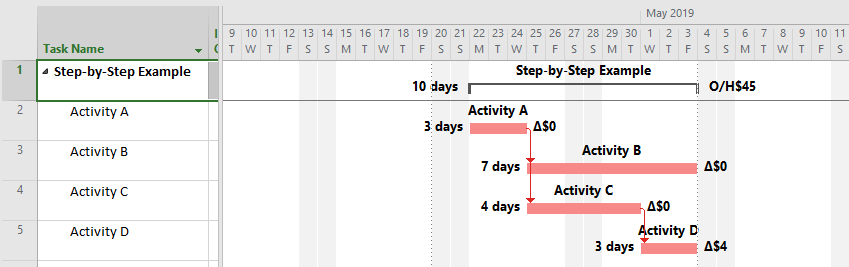
Figure 6: Schedule shortened to 10 days
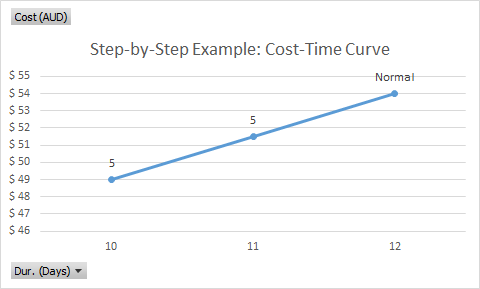
Figure 7: MS Excel chart showing changes in cost for successively shorter schedule (10 days)
STEP 3:
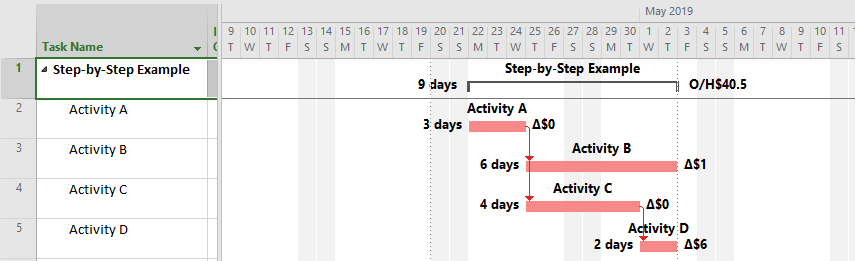
Figure 8: Schedule shortened to 9 days
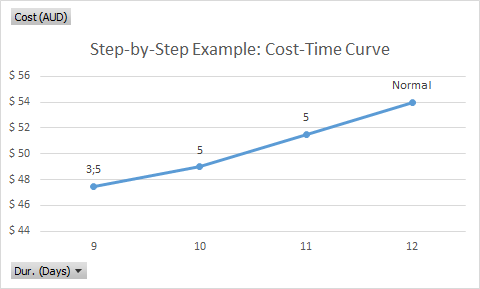
Figure 9: MS Excel chart showing changes in cost for successively shorter schedule (9 days)
STEP 4:
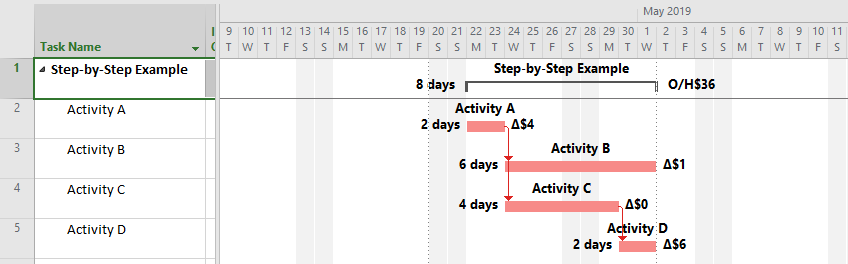
Figure 10: Schedule shortened to 8 days
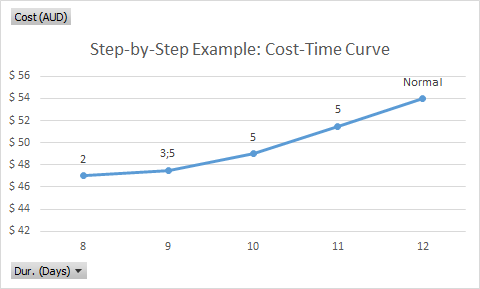
Figure 11: MS Excel chart showing changes in cost for successively shorter schedule (8 days)
STEP 5:
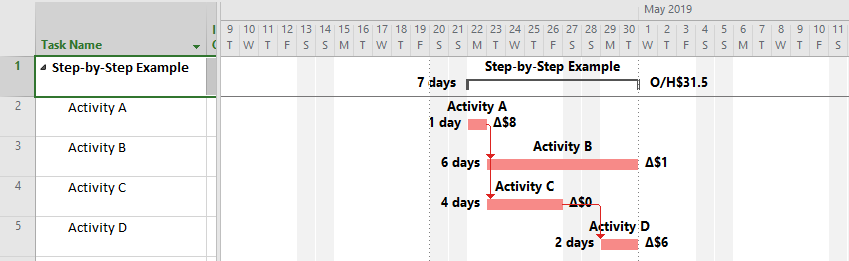
Figure 12: Schedule shortened to 7 days
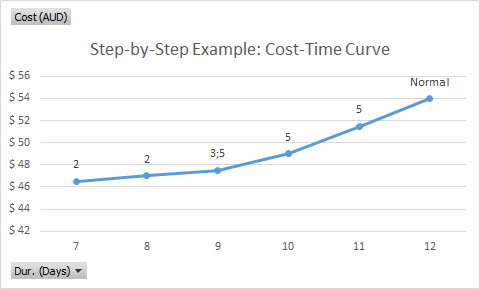
Figure 13: MS Excel chart showing changes in cost for successively shorter schedule (7 days)
STEP 6:
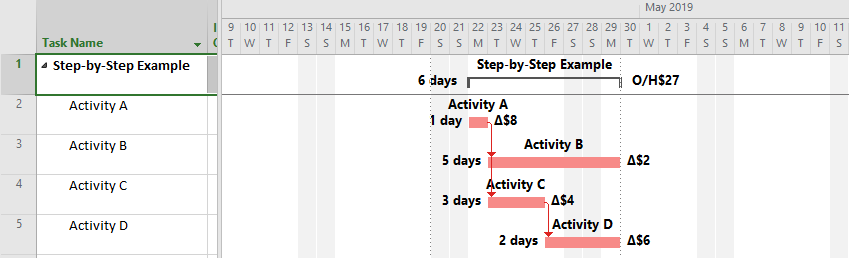
Figure 14: Schedule shortened to 6 days
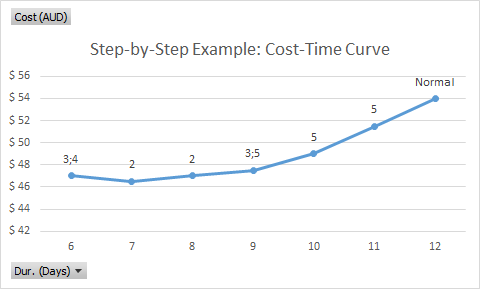
Figure 15: MS Excel chart showing changes in cost for successively shorter schedule (6 days)
STEP 7:
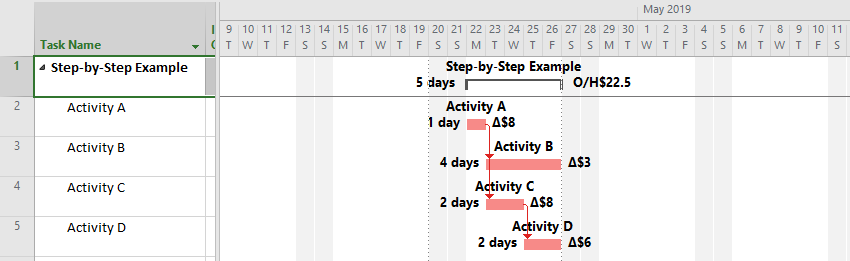
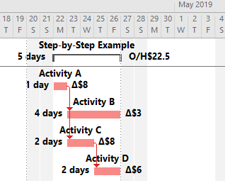
Figure 16: Schedule shortened to 5 days
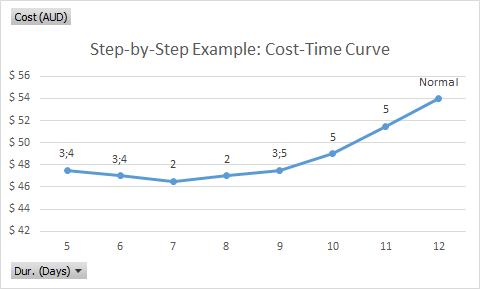
Figure 17: MS Excel chart showing changes in cost for successively shorter schedule (5 days)
CONCLUSION:
By inspection of Fig. 17, the least-cost schedule would cost $46.50 and have a duration of 7 days, whilst the shortest-duration schedule would cost $47.50 and have a duration of 5 days. Hence, an explicit decision can be made as to which is to be the desired schedule. The activities that are required to be shortened are noted above each data point.