Eleventh Example – Piping Repair & Improvement Project with Time and Cost Plan
If the Project Manager has a costed project schedule and wants to know options for minimising the project duration, what advice should the Project Planner provide? Read on to see how all key information can be provided through the #TimeCostCurves program.

Figure 1: Costed project schedule setup for producing the TimeCostCurve. Cost figures are taken from the source webpage.
Setup assumptions for TimeCostCurve program:
| Assumptions: | Assumed Value: | Remarks: |
|---|---|---|
|
$900/day | Assign Indirect Overheads resource to project task |
|
$29,184 | Direct (normal) costs |
|
ID 10, ID 12, ID 19 | Assume can crash by only 1 full day only (not partial days) for each task. |
|
Direct Task Cost = Direct Labour + Direct Materials | Direct |
|
$88/hr | Onsite loaded |
|
$80/hr | Office-based |
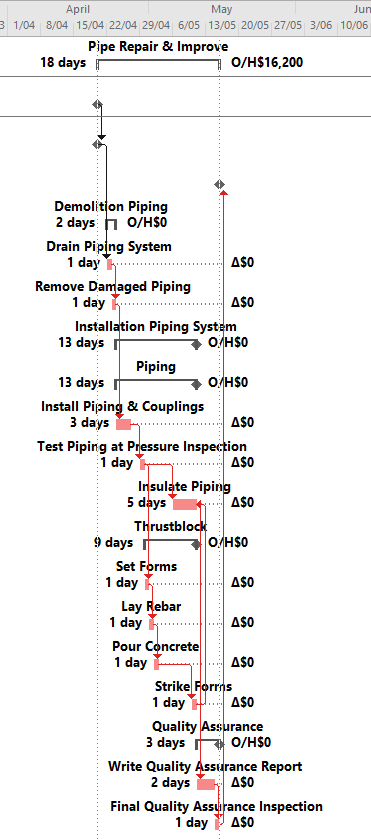
Figure 2: Normal conditions schedule.


Figure 3: TimeCostCurve with Task ID data points
Advice based on TimeCostCurve program:
| Schedule: | Duration (days): | Cost ($): | Remarks: |
|---|---|---|---|
| Normal schedule | 18 days | $ 45,834 | |
| Least-cost schedule | 17 days | $ 45,188 | |
| Least-time schedule | 16 days | $ 46,336 | |
| Fully-crashed schedule | 16 days | $ 46,336 | There is no added cost compared to the least-time schedule (which would be of no benefit since the critical path cannot be further shortened). |
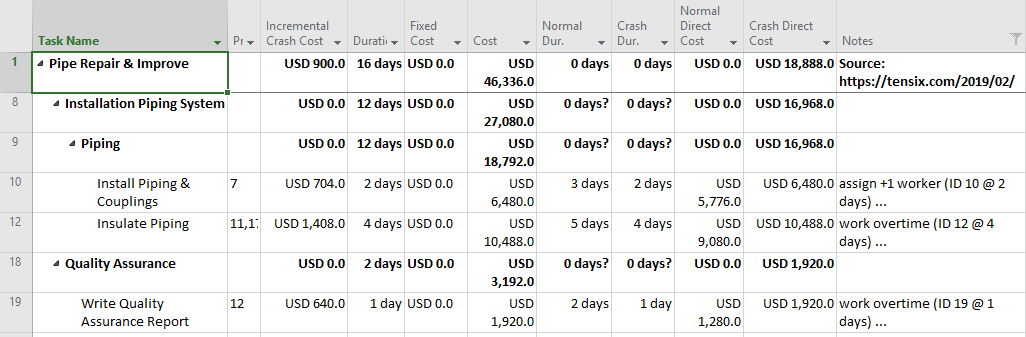
Figure 4: Schedule filtered for expedited activities with reasons.
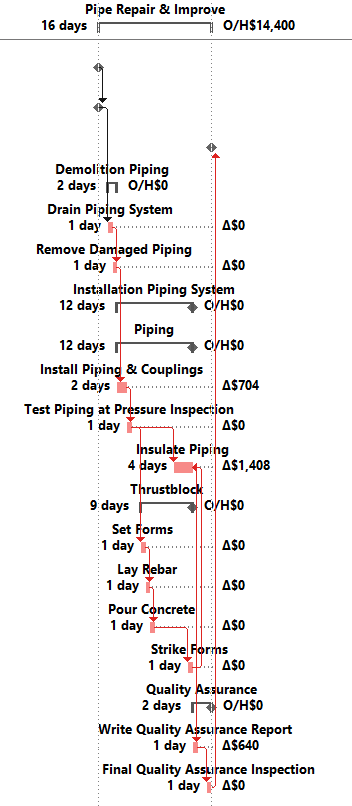
Figure 5: Least-time schedule