Fourth Example – Fox Village Store Opening
Should the company opening the Fox Village Store proceed with the normal schedule or should it attempt a ‘crash’ program? Read on to see how the Cost-Time Curve chart is produced using the #TimeCostProblemSolved program.

Figure 1: The resulting cost-time curve

Figure 2: Setup the schedule for producing the cost-time curve.

Figure 3: Normal schedule. Indirect costs (overheads) are set at $900 per day. Total direct costs are $85,000 for this normal schedule.
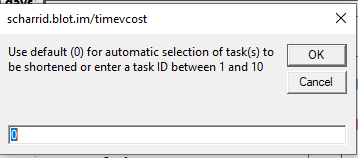
Figure 4: Click the code button, and select default (0) to run the program. Repeat 15 times to proceed to the below stage

Figure 5: 'Crashed' schedule, represented on the Cost-Time Curve below as the least-time data point (ie 40 days, $136,000)..
Figure 6: Cost-Time Curve showing the least-cost schedule would be 50 days, costing $133,500 and the least-time schedule would be 40 days, costing $136,000. #TimeCostProblemSolved